RCM Advisory
January 2020Insolvency news | Total number of personal insolvencies are at the highest annual level since 2010 and company liquidations are on the rise too.
Insolvency Diary.

The total number of individual insolvencies at the highest annual level since 2010
The insolvency service has released insolvency statistics for 2019 Q4.
Personal insolvency Statistics
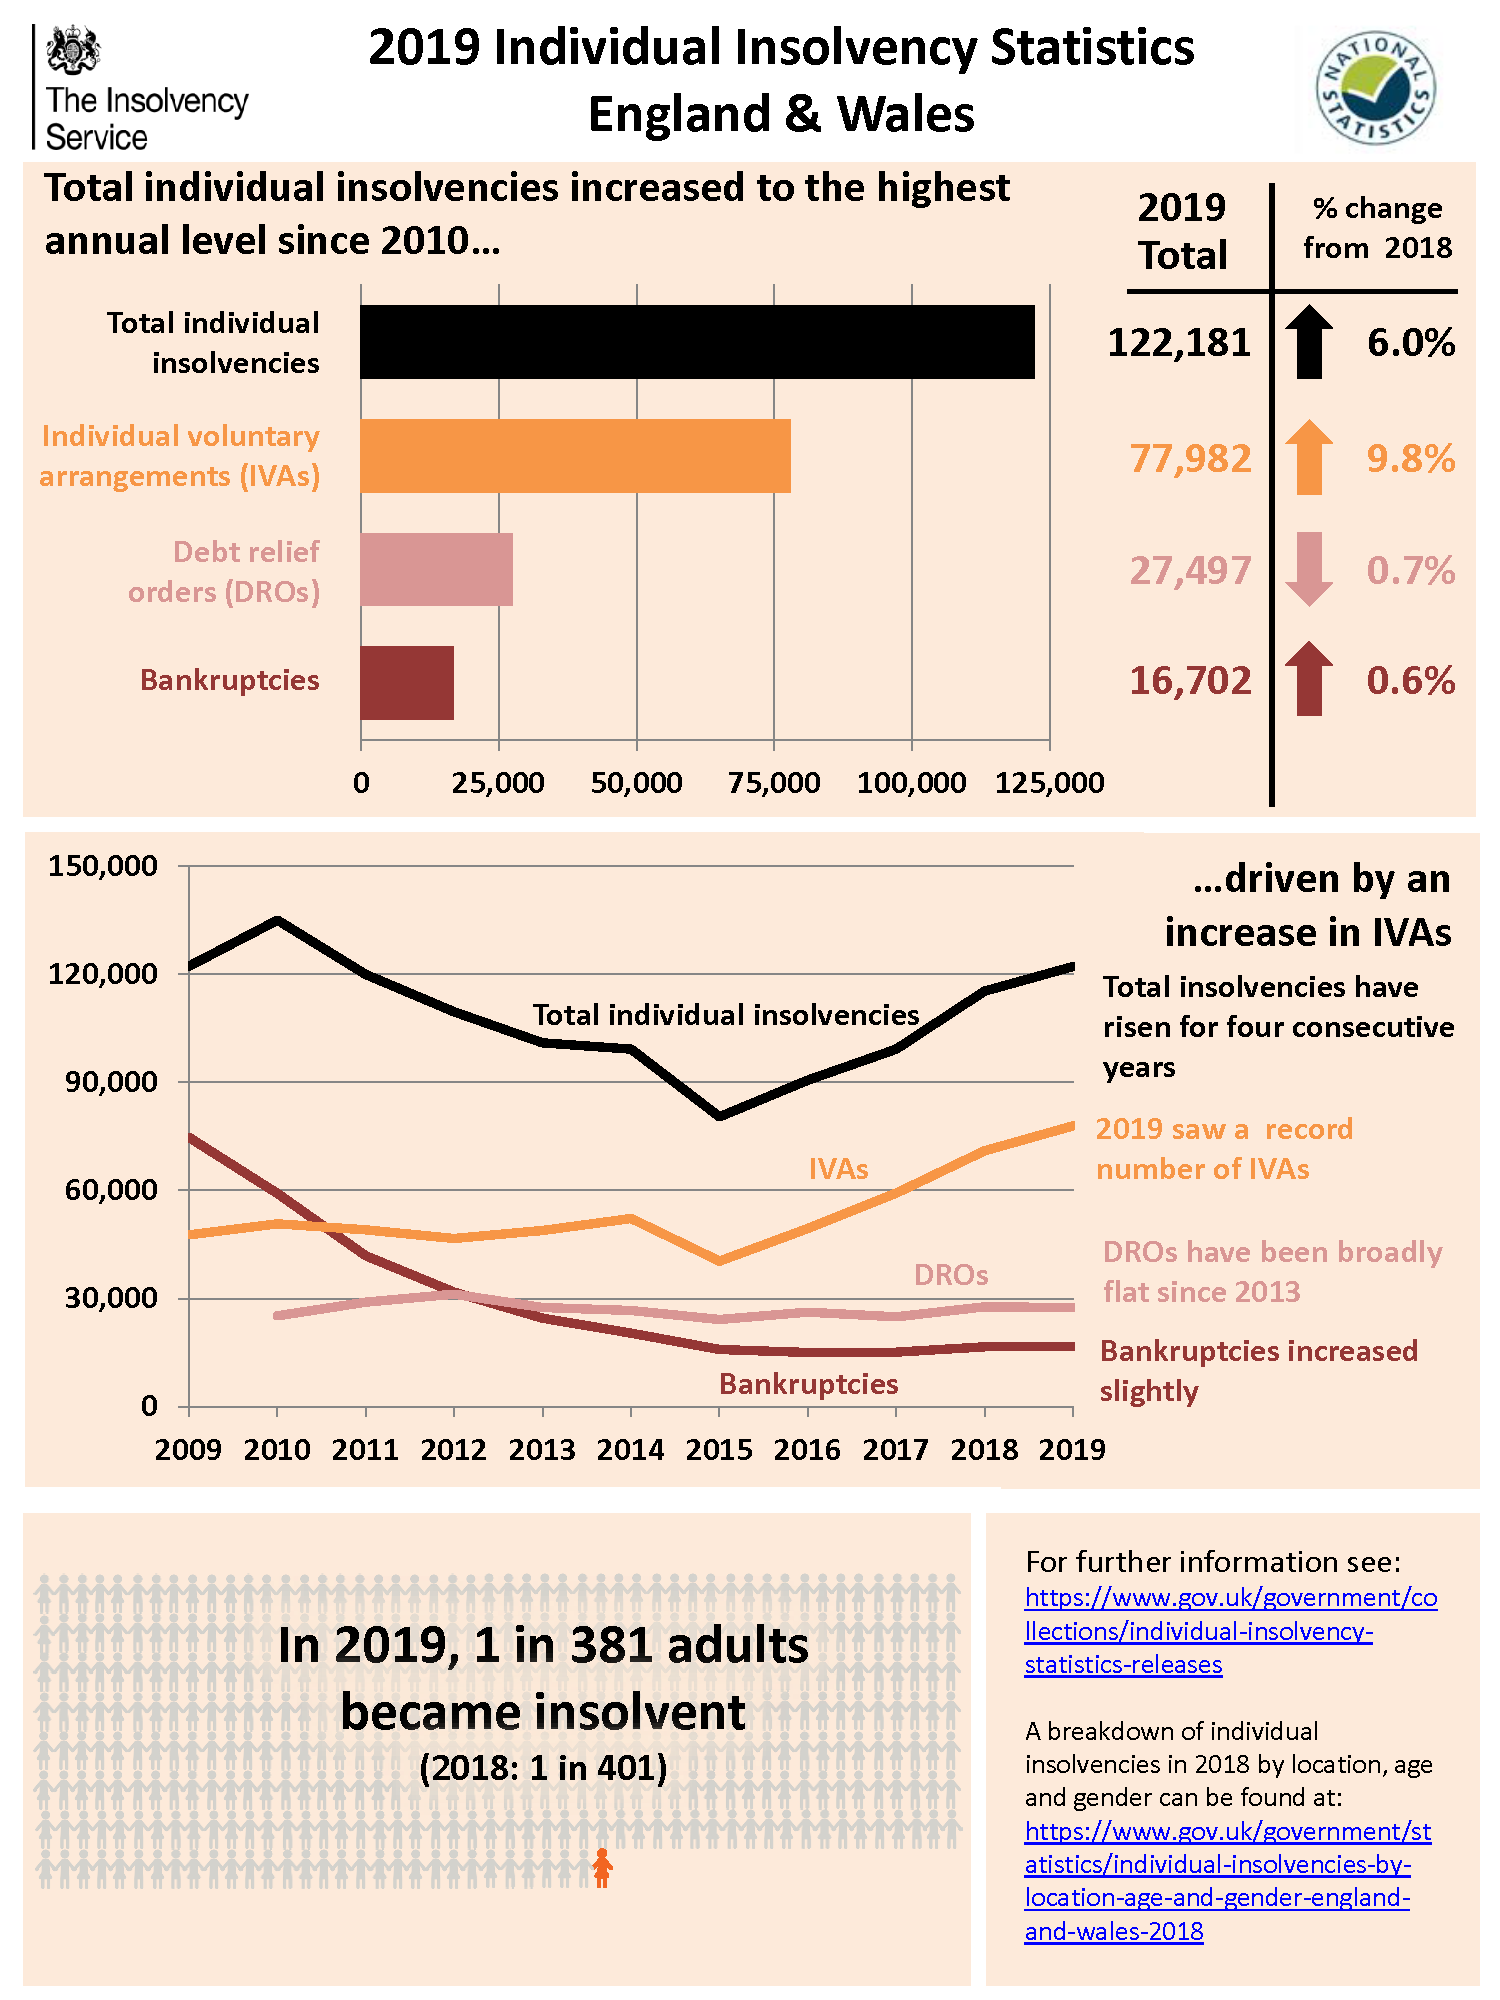
The total number of individual insolvencies has increased for the fourth consecutive year to 122,181. This is a rise of 6% compared to 2018. The increase was largely driven by a 9.8% increase in IVAs to 77,982, which is the highest annual level of IVAs recorded since their introduction in 1987. Personal Bankruptcies increased slightly compared to 2018 while debt relief orders decreased slightly.
For 2019, IVAs accounted for 63.8% of all individual insolvencies compared to 2010 when they only accounted for 37.5%. Over the same period bankruptcies have become less common, falling from 43.8% to 13.7% over the same period.
Q4 2019 Individual Insolvency Statistics
Source: The Insolvency Service
Underlying company insolvencies for 2019 increased to their highest annual level since 2013
Company insolvency statistics
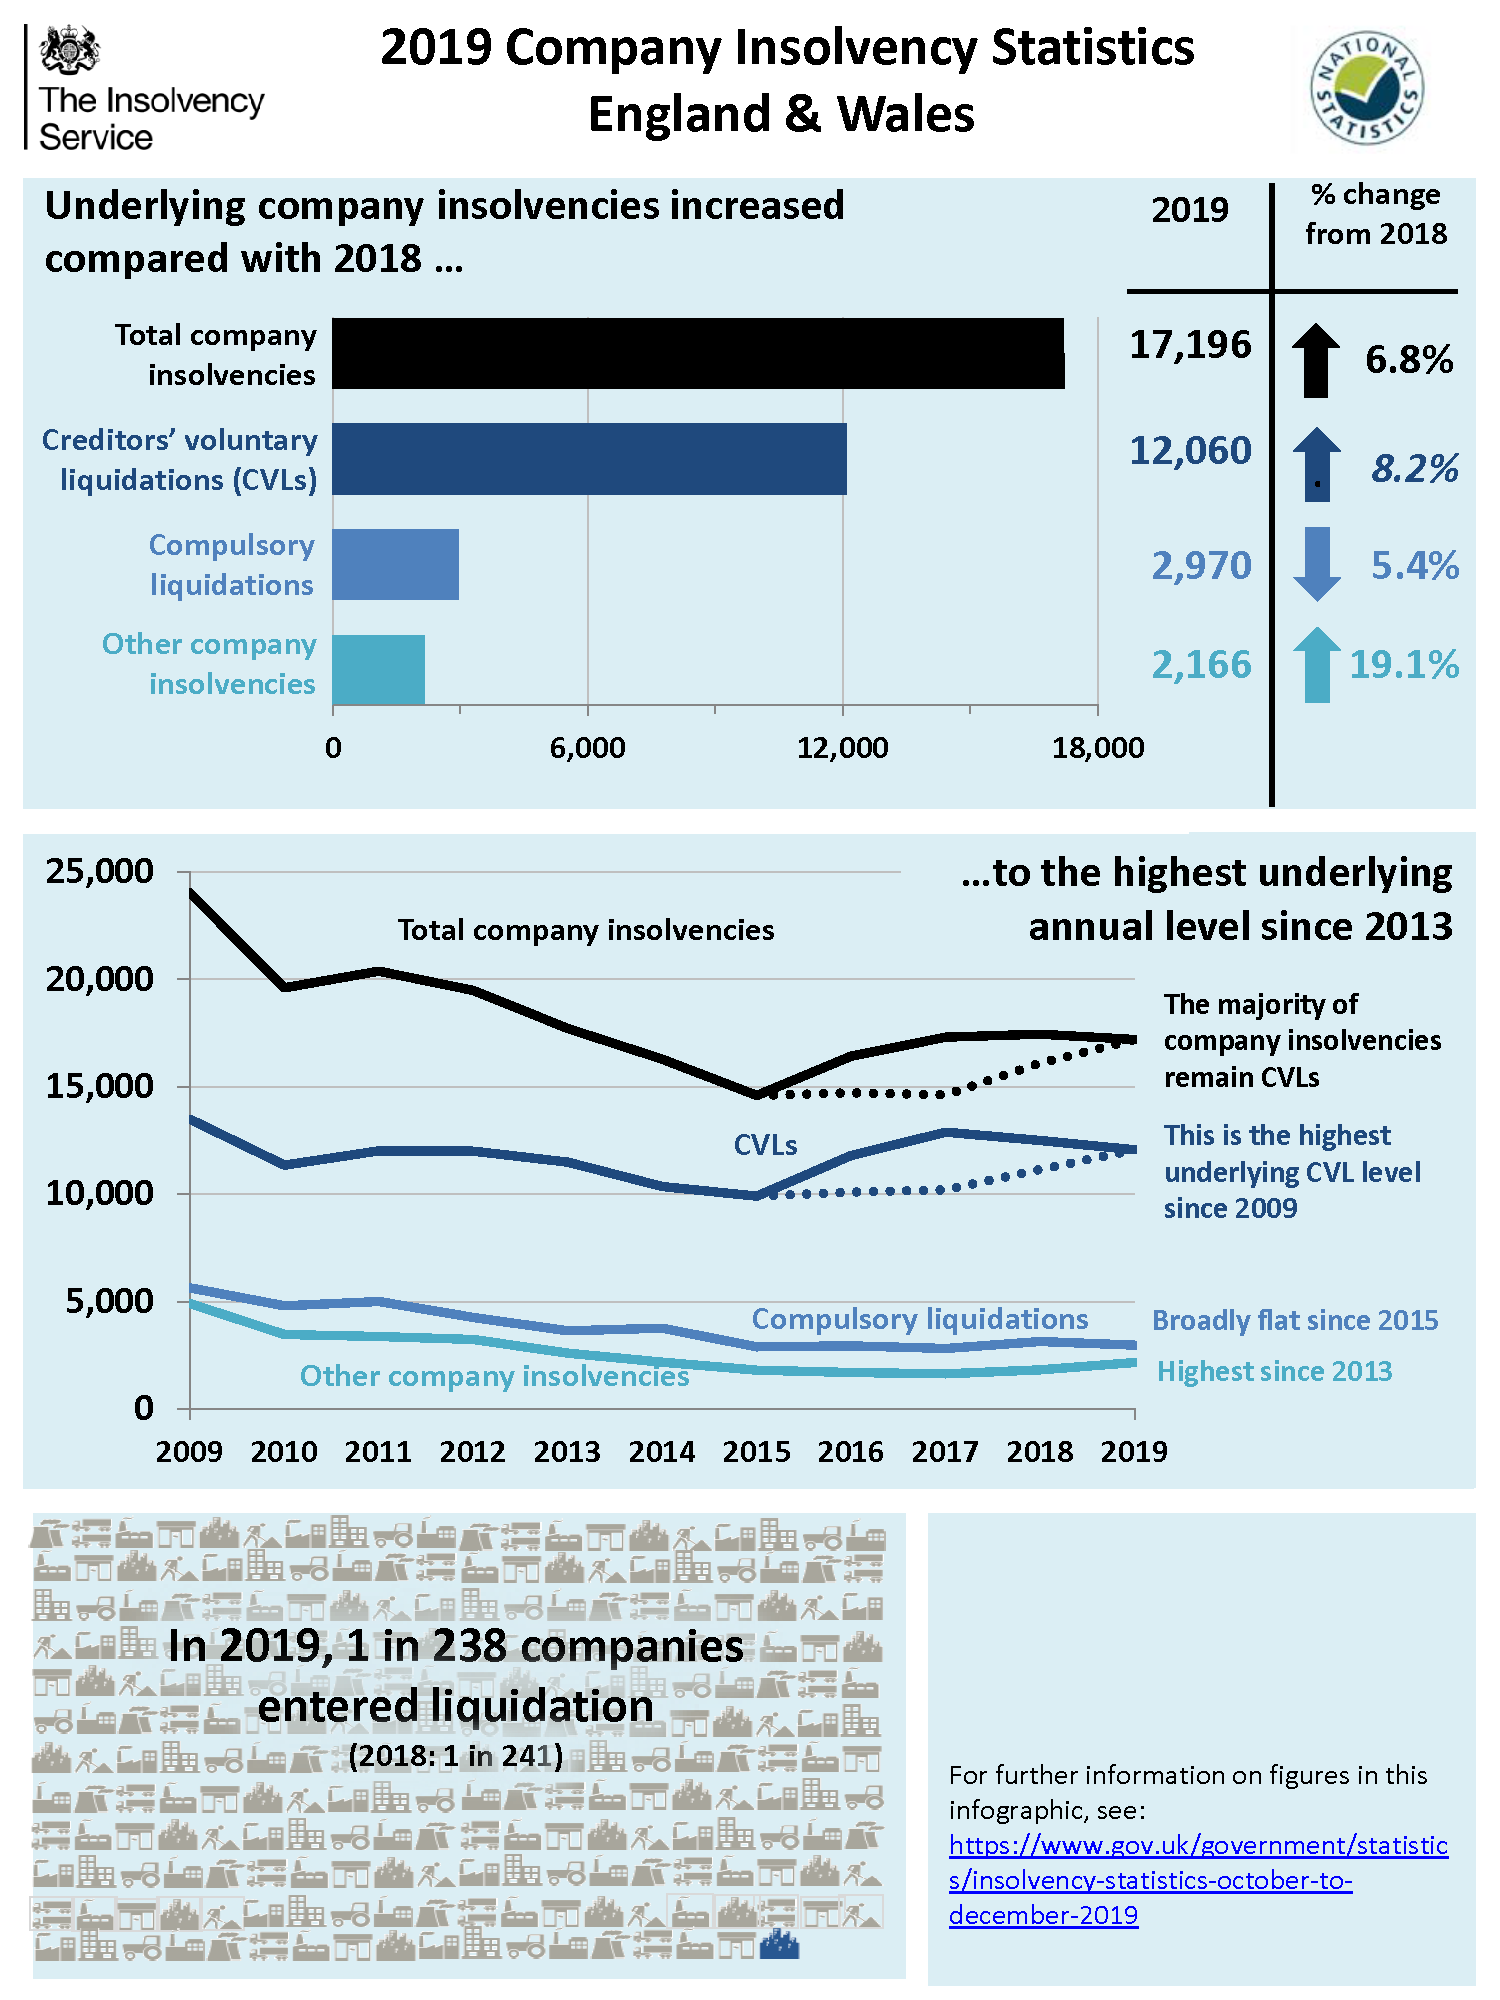
Total underlying company insolvencies increased to their highest annual level since 2013 with the total number being 8.1% higher than the same period last year.
The increase has largely been driven by an increase in CVLs (creditors' voluntary liquidations), which have now reached their highest annual level since 2009. The number of Administrations increased in 2019 when compared to 2018, compulsory liquidations decreased and company voluntary arrangements (CVAs) were flat.
For 2019 the total number of company insolvency totalled 17,196, with 2,970 compulsory liquidations, 12,060 CVLs, 1,814 Administrations and 351 CVAs.
Q4 2019 Company Insolvency Statistics
Source: The Insolvency Service
Read the Full reports here:
2019 Annual Personal Insolvency Statistics
2019 Annual Company Insolvency Statistics